


Hey - it’s Alex, this time together with Björn, GTM expert, book author, podcast host, and AI-native entrepreneur.
More LinkedIn impressions. More website visitors. More demos. More pipeline.
Sounds great. But are you actually winning more customers?
When we review the GTM of early-stage SaaS and AI startups, we often see the same problem: founders either track too little or get lost in too many metrics.
They know how many meetings they booked last month. But they don't know how many became qualified opportunities. Or whether the pipeline they created is enough to hit their revenue target.
You don’t need to review 23 metrics every Monday morning. You need a small set of signals that help you investigate where your GTM might be breaking.
Today, we’ll show you the most important GTM metrics, how to reverse-engineer your revenue goal, and how to turn the numbers into actual GTM decisions.
In case you missed the last 3 episodes:
✅ 2 GTM AI agents for Founder-Led Teams
✅ 9 GTM infographics to grow to 1€ million ARR
✅ One founder needs to own GTM
Before we start, 2 important links for you:
1. Start with the ICP Gate
Before analyzing your GTM metrics, try to segment contacts, opportunities, and customers by ICP tier, use case, and source wherever your data allows.
Otherwise, 20 new SQLs might look great, even if 15 are small, low-fit accounts and only five come from your best-fit customers.
At minimum, we recommend these CRM fields: ICP tier, use case, original lead source, deal value (annualized recurring revenue), expected close date, and lost reason.
And one field you should never skip:
“How did you hear about us?”
Ask it as an open question and save the prospect’s own words. Your analytics might say “Direct Traffic,” while the buyer says “I’ve followed the founder on LinkedIn for months” or “A friend recommended you.” Track both sources.
2. Start with these 8 metrics
You don’t need to recreate this dashboard in your CRM. Use it as guidance for understanding where your GTM needs attention and start with the numbers you can reliably measure.
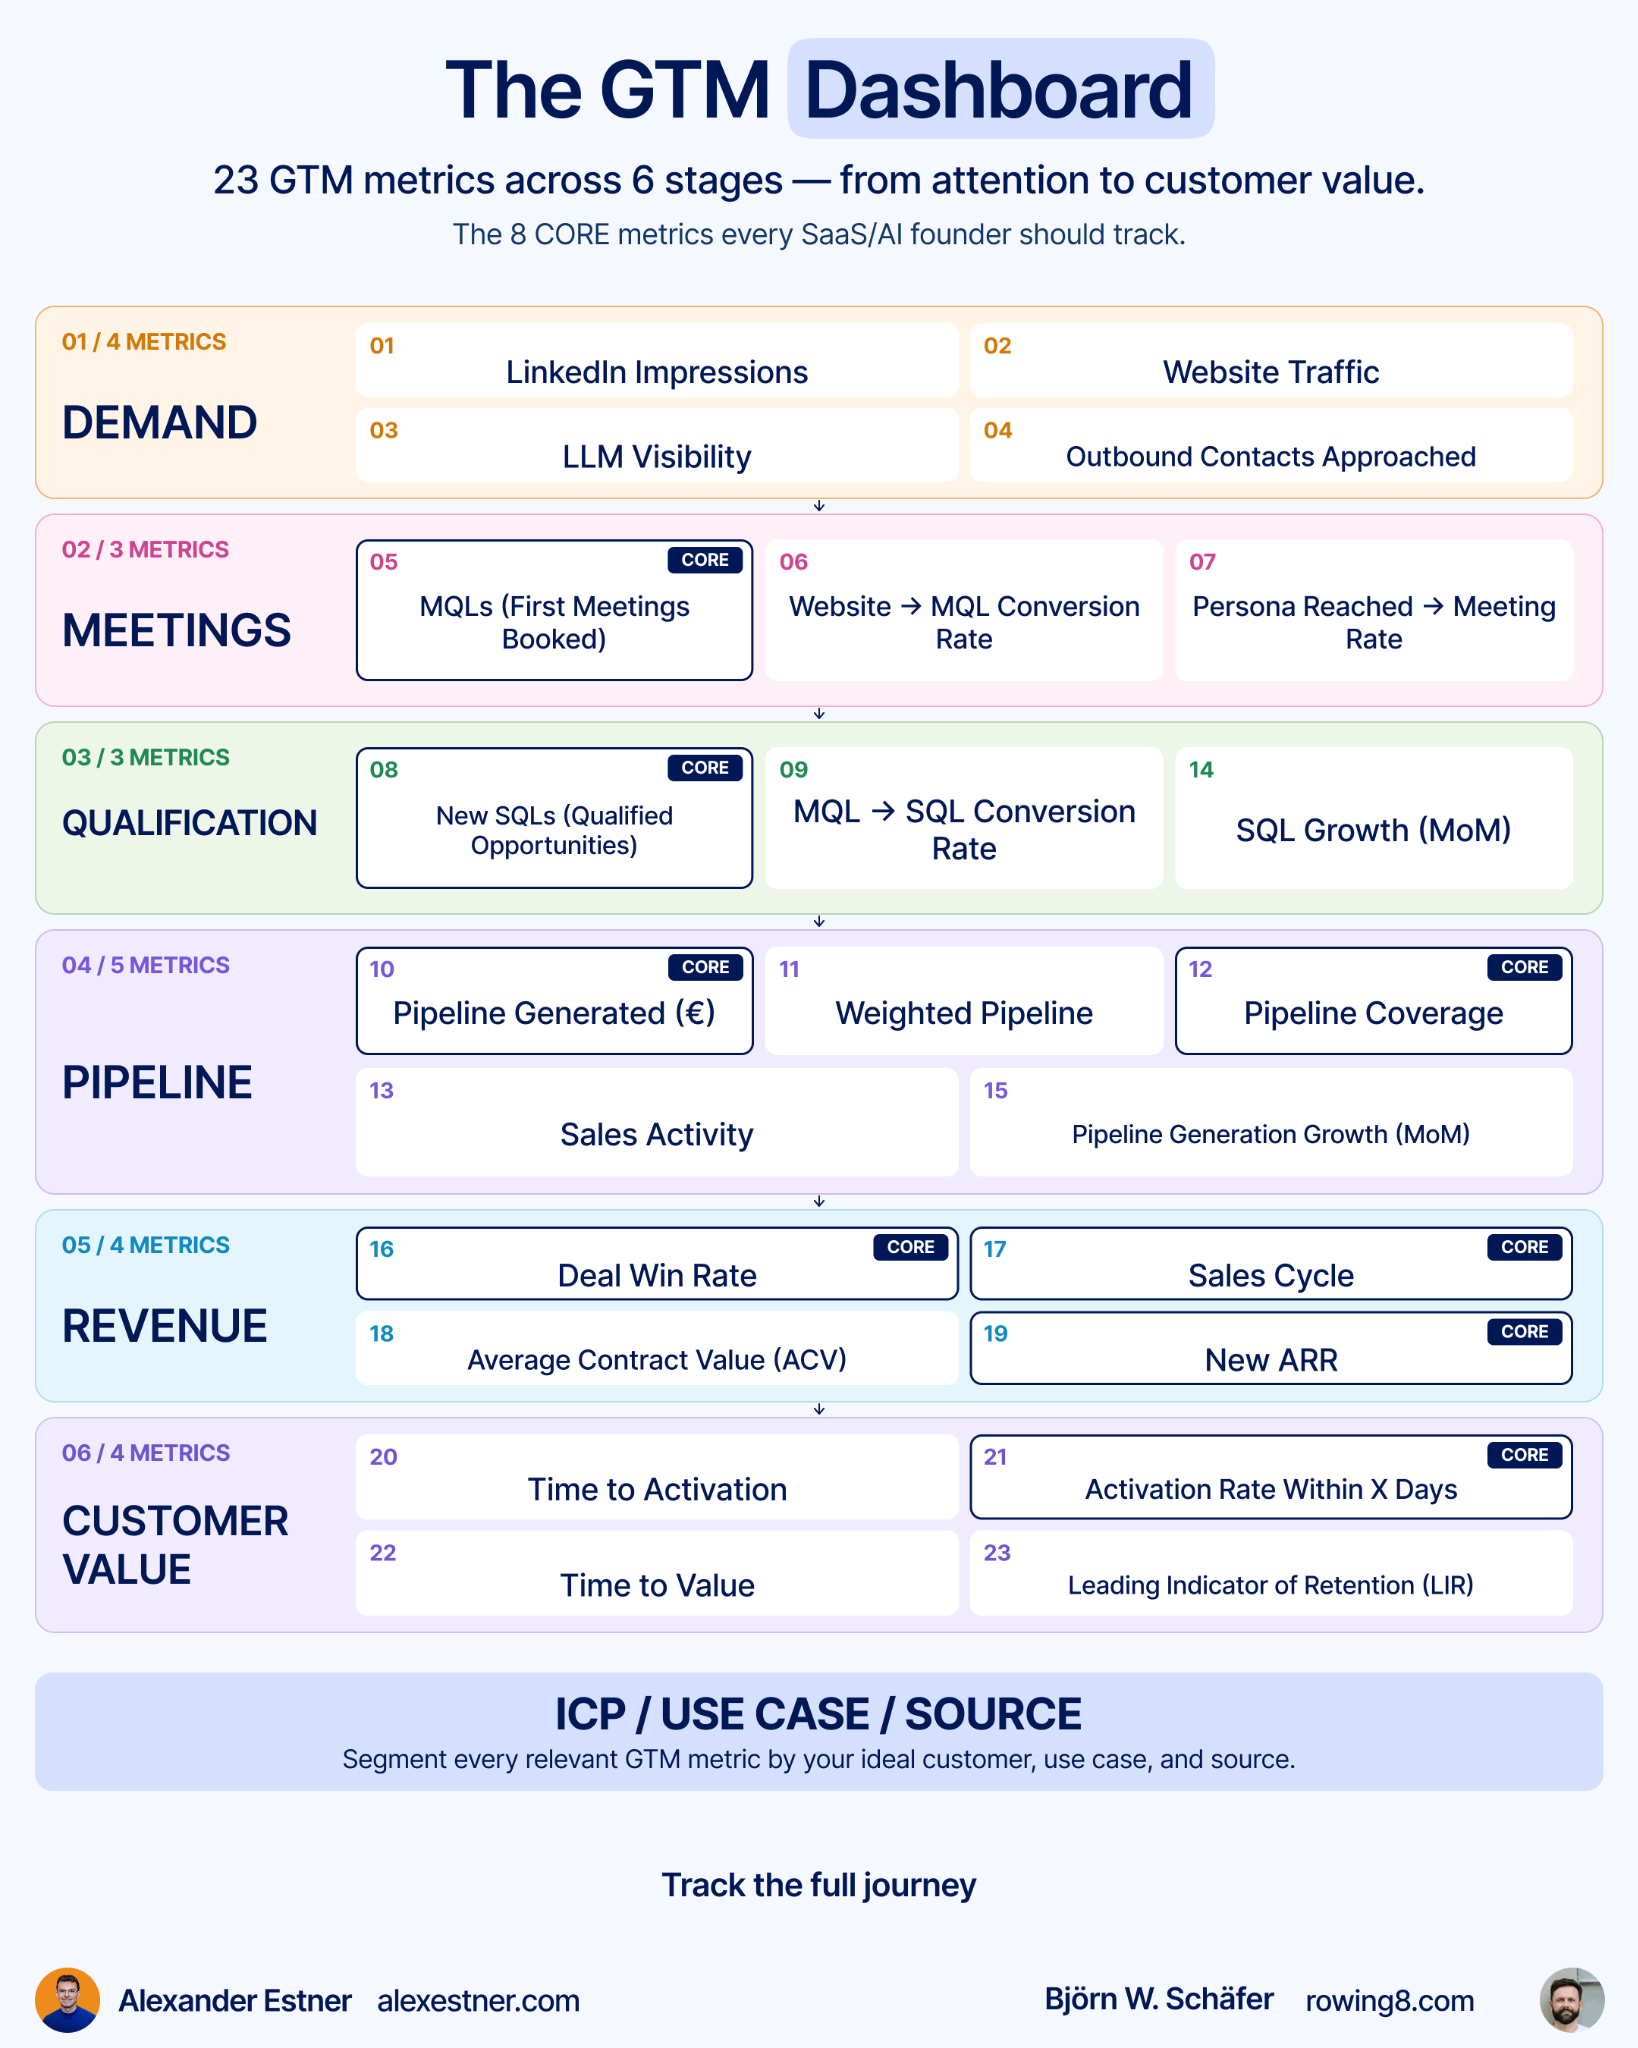
For a founder-led, sales-led GTM, this is the scorecard we would start with.
Here, MQL means the first sales meeting booked, not a signup or form fill:
MQLs (First Meetings Booked) — Are we generating enough conversations?
New qualified opportunities (SQLs) — How many meetings have ICP fit, use-case fit, and urgency?
New pipeline generated (€) — How much potential annual recurring revenue did those SQLs create?
Pipeline coverage — Do we have enough relevant pipeline to hit our revenue target?
Deal win rate — What percentage of qualified opportunities become paying customers?
Sales cycle — How long does it typically take from a qualified opportunity (SQL) to Closed Won?
New ARR — How much new recurring revenue are we actually winning?
Activation rate — Are new customers adopting the product within the expected window?
If you’re still working toward your first customers, prioritize meetings, SQLs, and pipeline. Review activity weekly; interpret win rate, ARR, and activation over meaningful periods or customer cohorts.
The point isn’t to make all eight numbers go up at the same time. It’s to understand which part of your GTM needs attention.
3. Reverse-engineer your GTM targets
Let’s say your goal is €60,000 in new ARR per month.
Assume €12,000 ACV, a 25% SQL → Closed Won rate, 50% of MQLs (first meetings booked) turning into SQLs, and an average sales cycle of 4 months from SQL creation to Closed Won.
Work backward:
€60,000 new ARR → 5 new customers → 20 SQLs → 40 MQLs (first meetings booked).
Now assume 50% of meetings come from inbound and 50% from outbound.
Outbound: 20 meetings
With a 5% contact-to-meeting rate, you need 400 unique contacts approached per month. That’s 20 new contacts per working day, assuming 20 working days.
Inbound: 20 meetings
With a 2% website visitor-to-meeting conversion rate, you need 1,000 unique website visitors per month.
Both conversion rates are example assumptions, not universal benchmarks. The inbound calculation also assumes all 20 inbound meetings originate from your website.
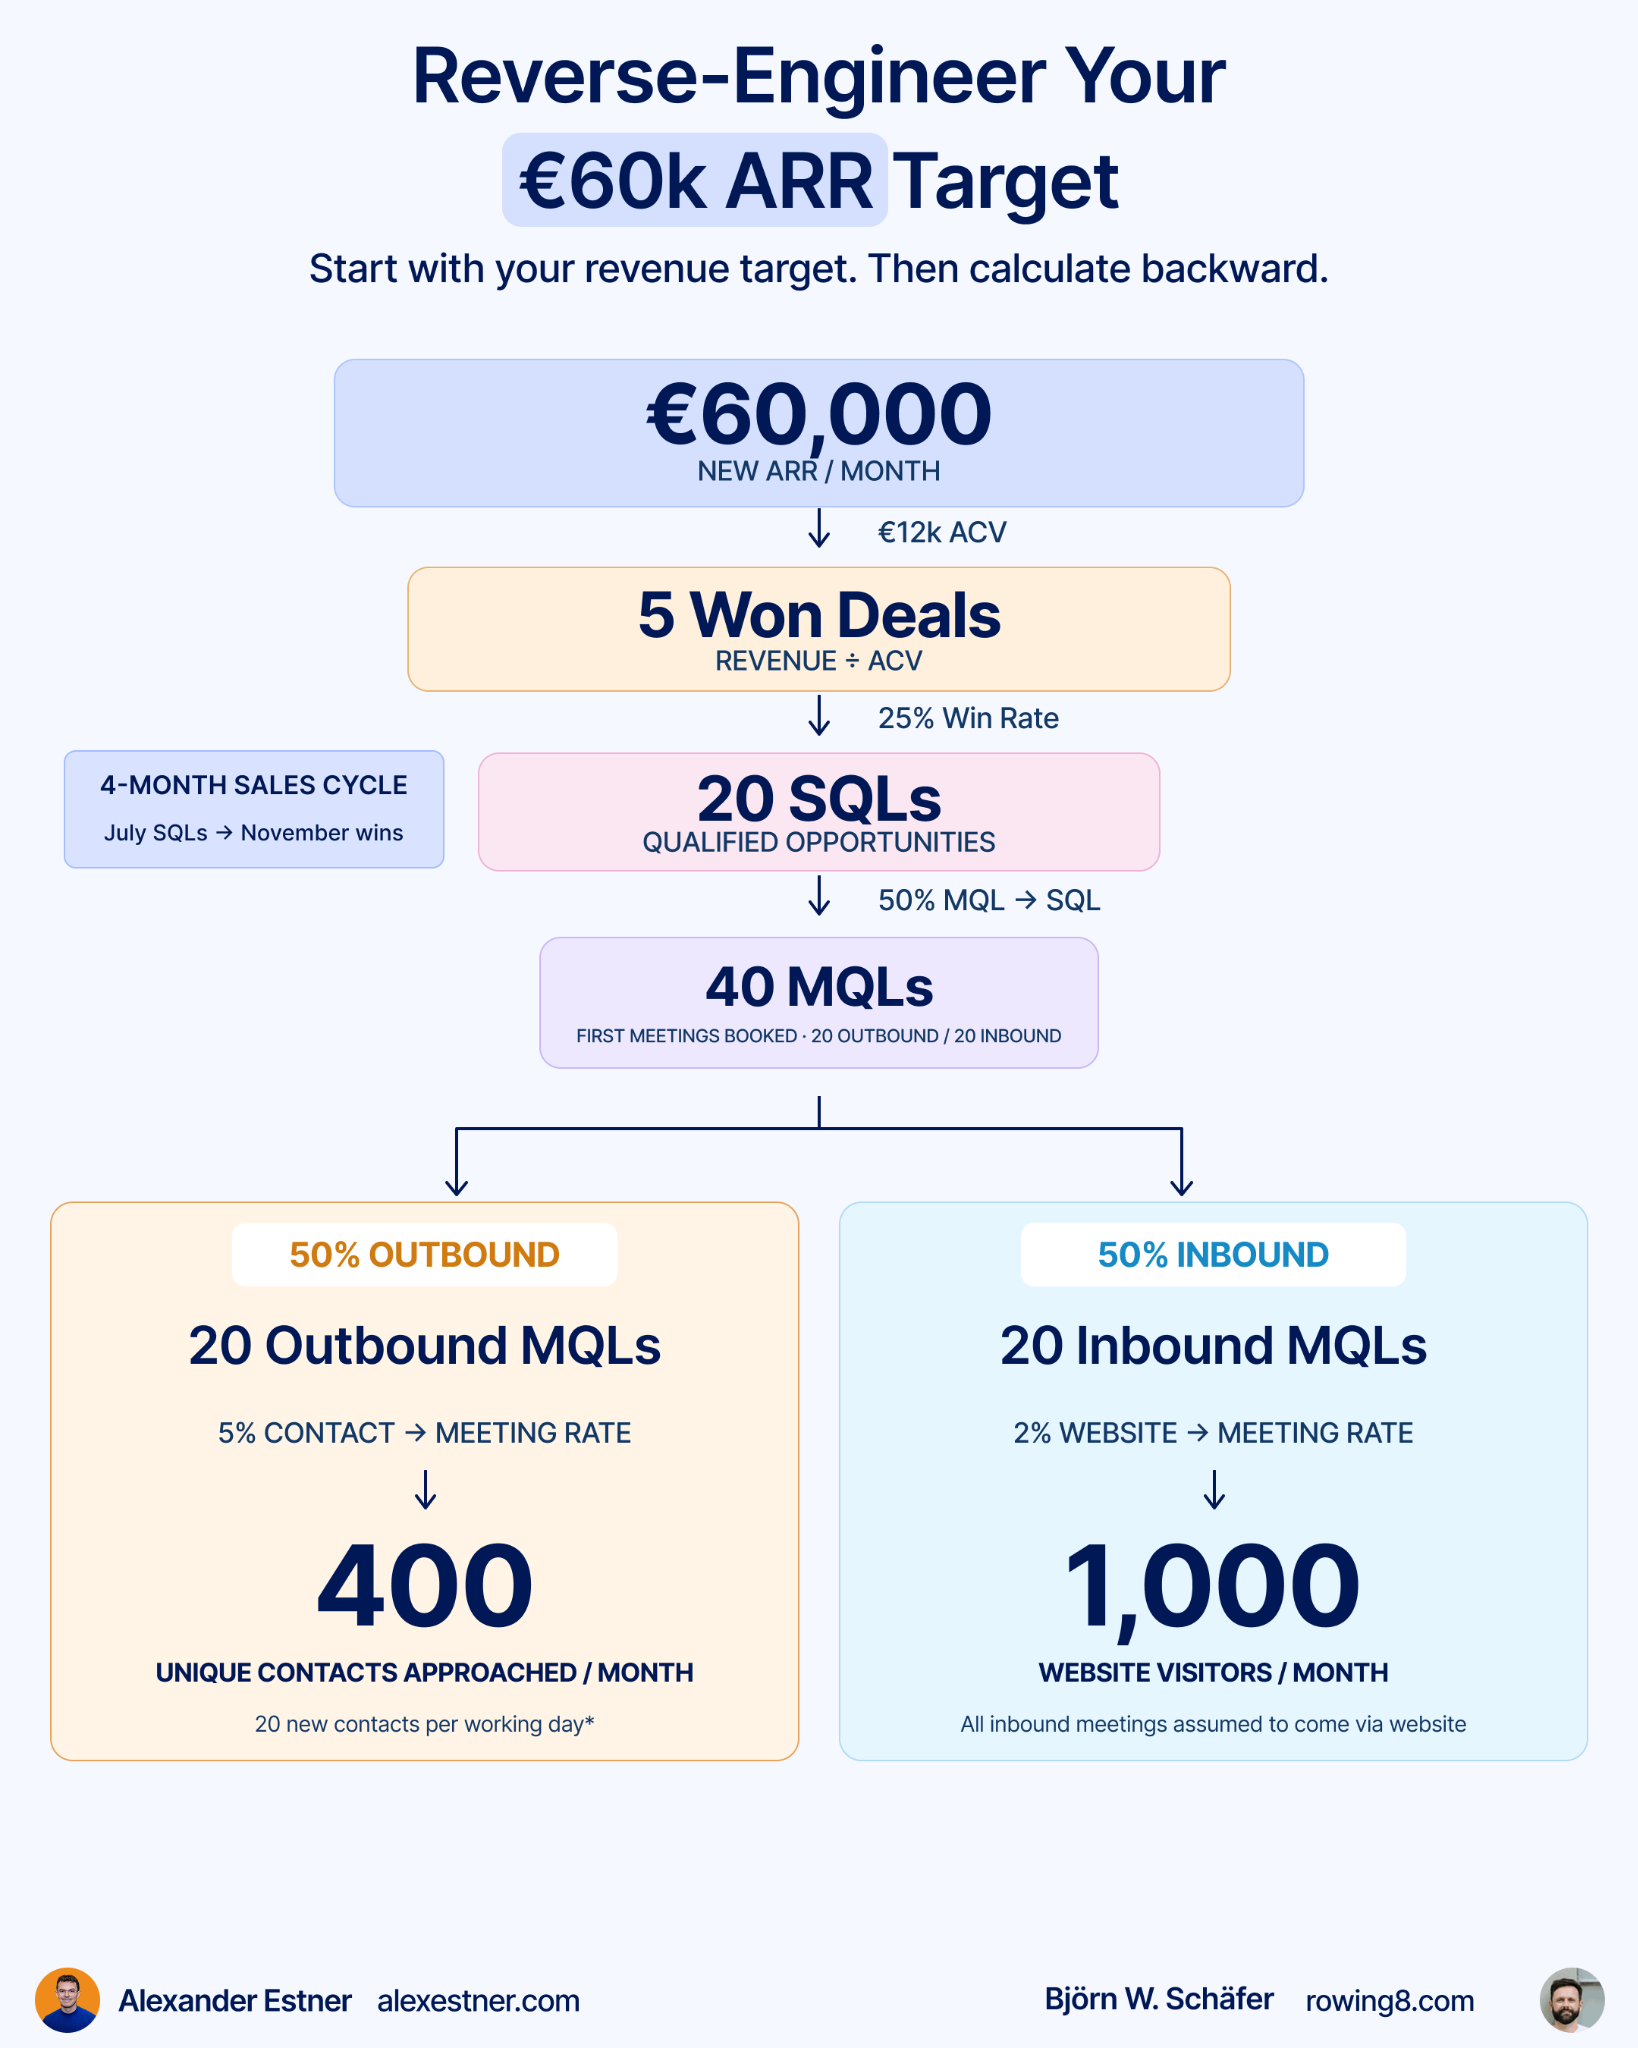
Now your targets are connected to a revenue outcome, instead of deciding randomly to “do more outbound” or “get more traffic.”
Now account for timing: with a 4-month SQL-to-Closed Won sales cycle, the 20 SQLs needed to support a €60,000 New ARR target in November would typically need to be created around July.
To generate those July SQLs, you’d need approximately 40 MQLs (first meetings booked) beforehand or around that time.
The 400 outbound contacts and 1,000 website visitors must happen early enough to feed those meetings.
Note: These are illustrative averages, not a promise that every deal closes exactly four months after qualification.
4. Use your dashboard to find the bottleneck
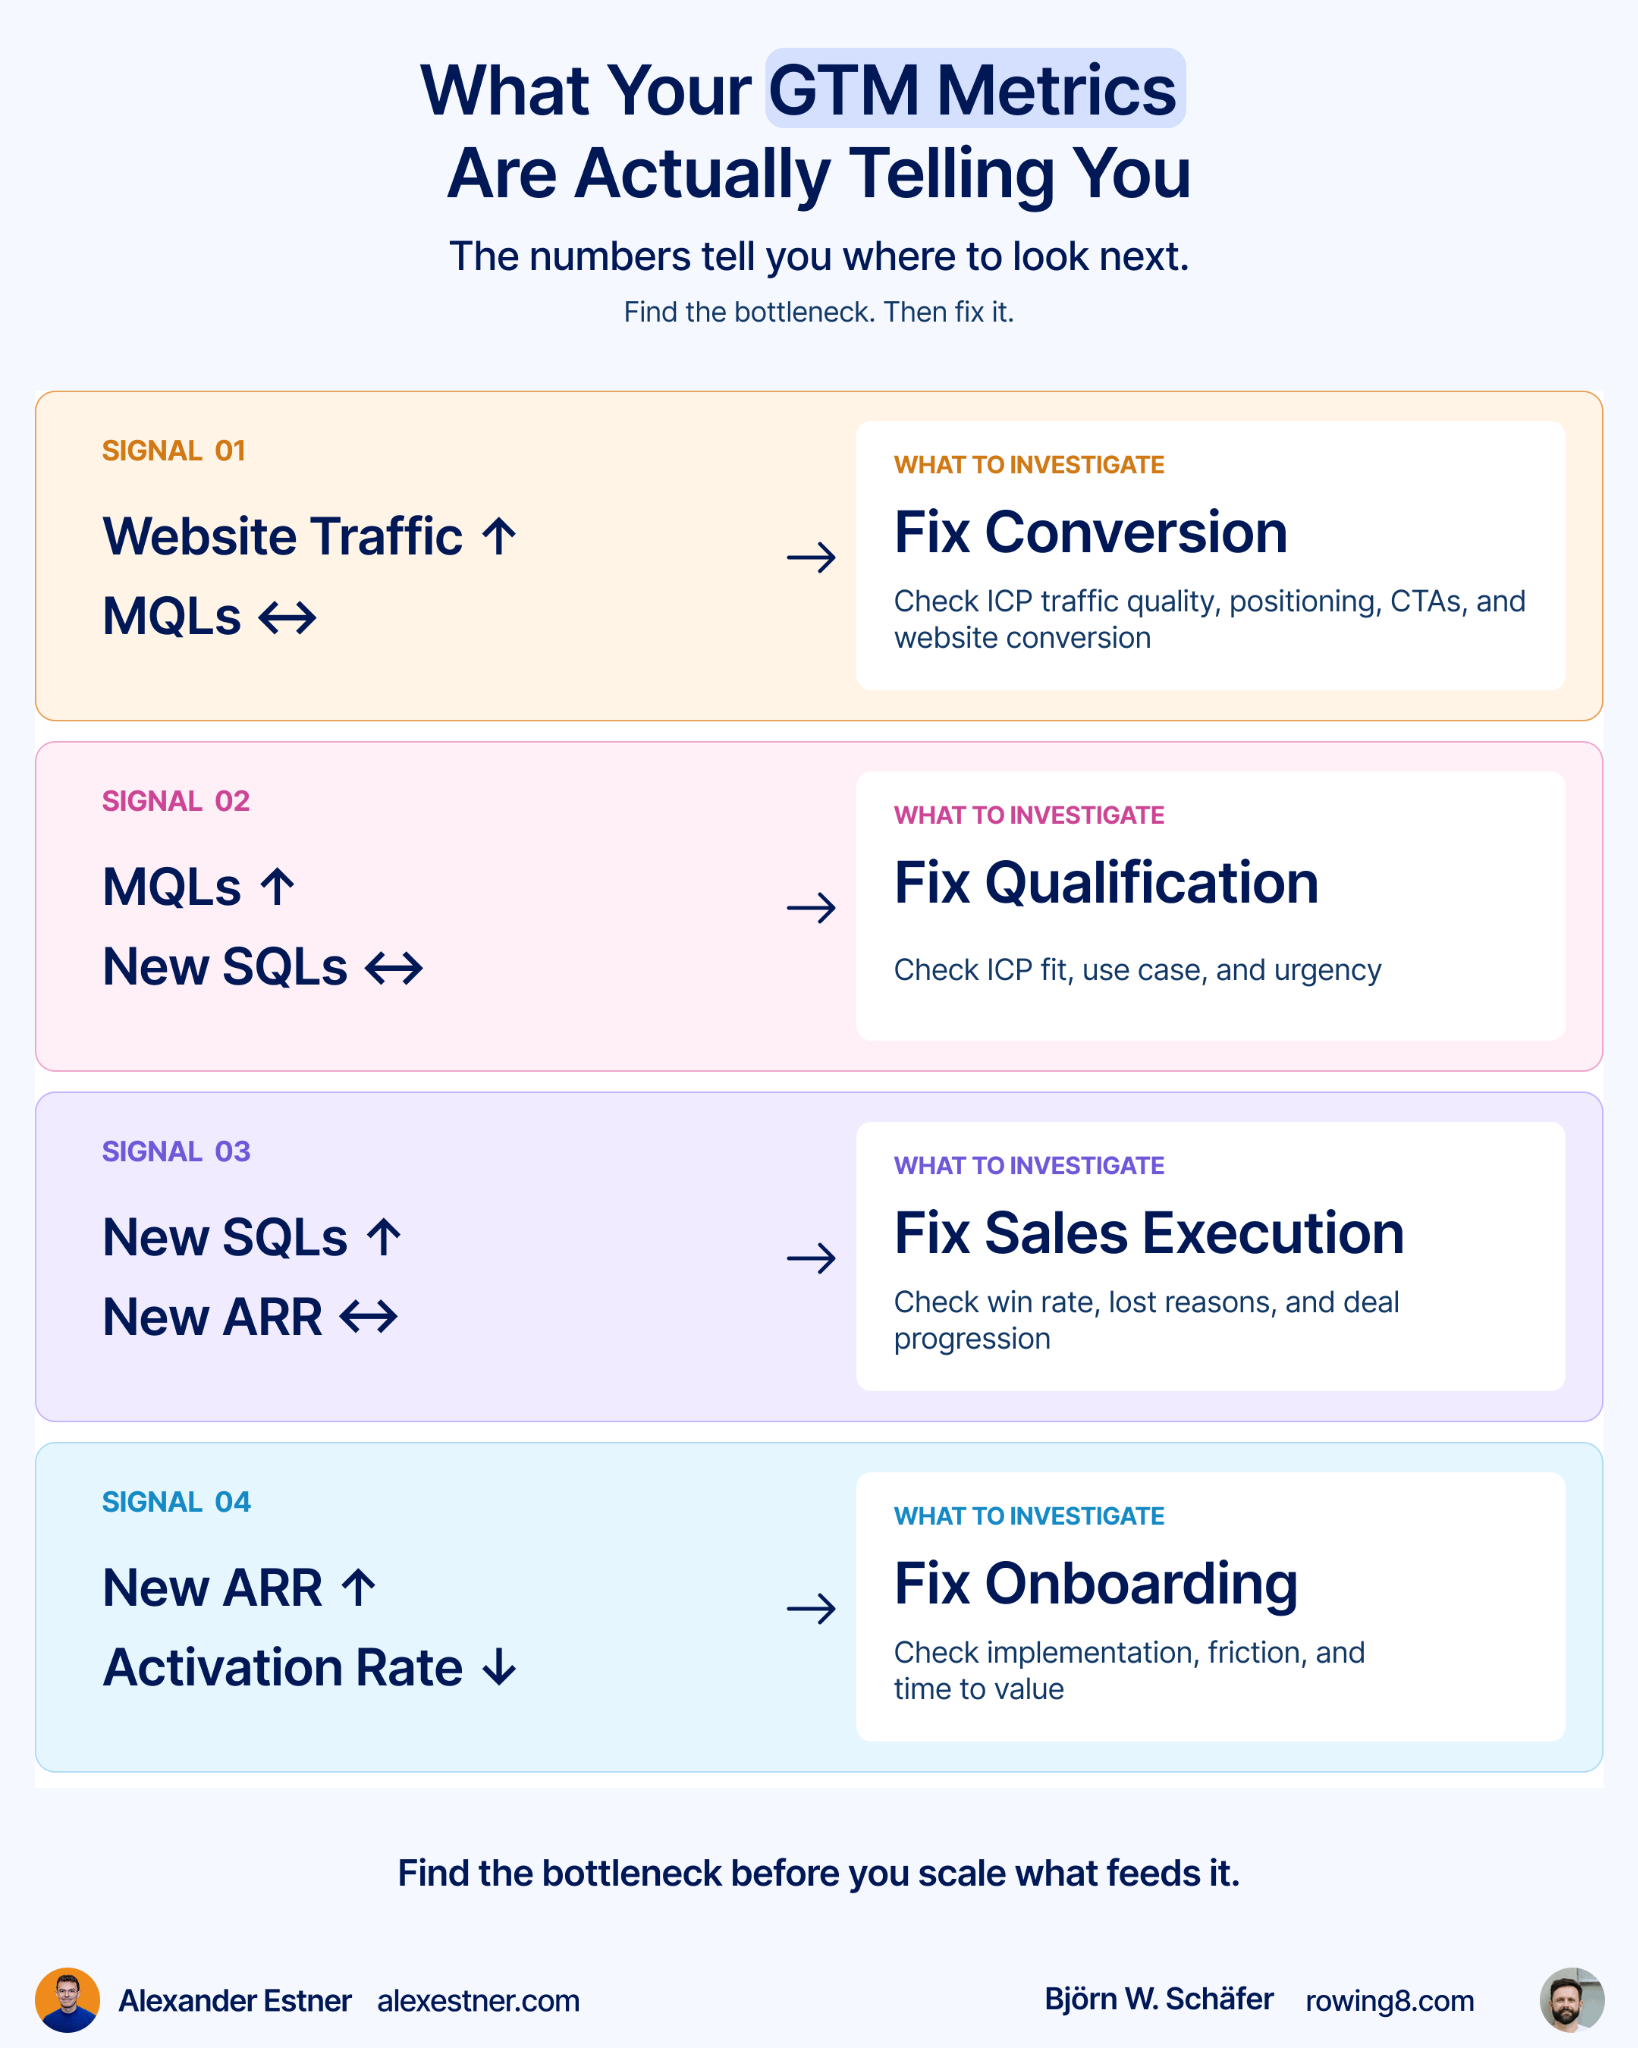
Four patterns we would investigate:
Traffic ↑, meetings ↔
→ Look at ICP traffic quality, positioning, CTAs, and website conversion.
Meetings ↑, SQLs ↔
→ Review targeting, lead sources, qualification, and discovery.
Pipeline ↑, new ARR ↔
→ Review urgency, lost reasons, win rate, and deal progression.
New ARR ↑, activation ↓
→ Review onboarding, implementation friction, and time to value.
The principle is simple: Find the bottleneck before investing more into the activities that feed it.
5. Make this a 20-minute weekly routine
5 minutes: Compare activity and pipeline with your plan, and review revenue and activation trends when there’s enough data.
10 minutes: Identify the biggest bottleneck by ICP, use case, or source.
5 minutes: Pick one specific improvement, assign an owner, and decide when to review it.
For example: “Our MQL → SQL conversion dropped. Most of the decline came from one outbound campaign targeting low-fit accounts. We’ll narrow the ICP and compare the next 20 MQLs (first meetings booked).”
That’s more useful than staring at a dashboard and deciding to “increase sales.”
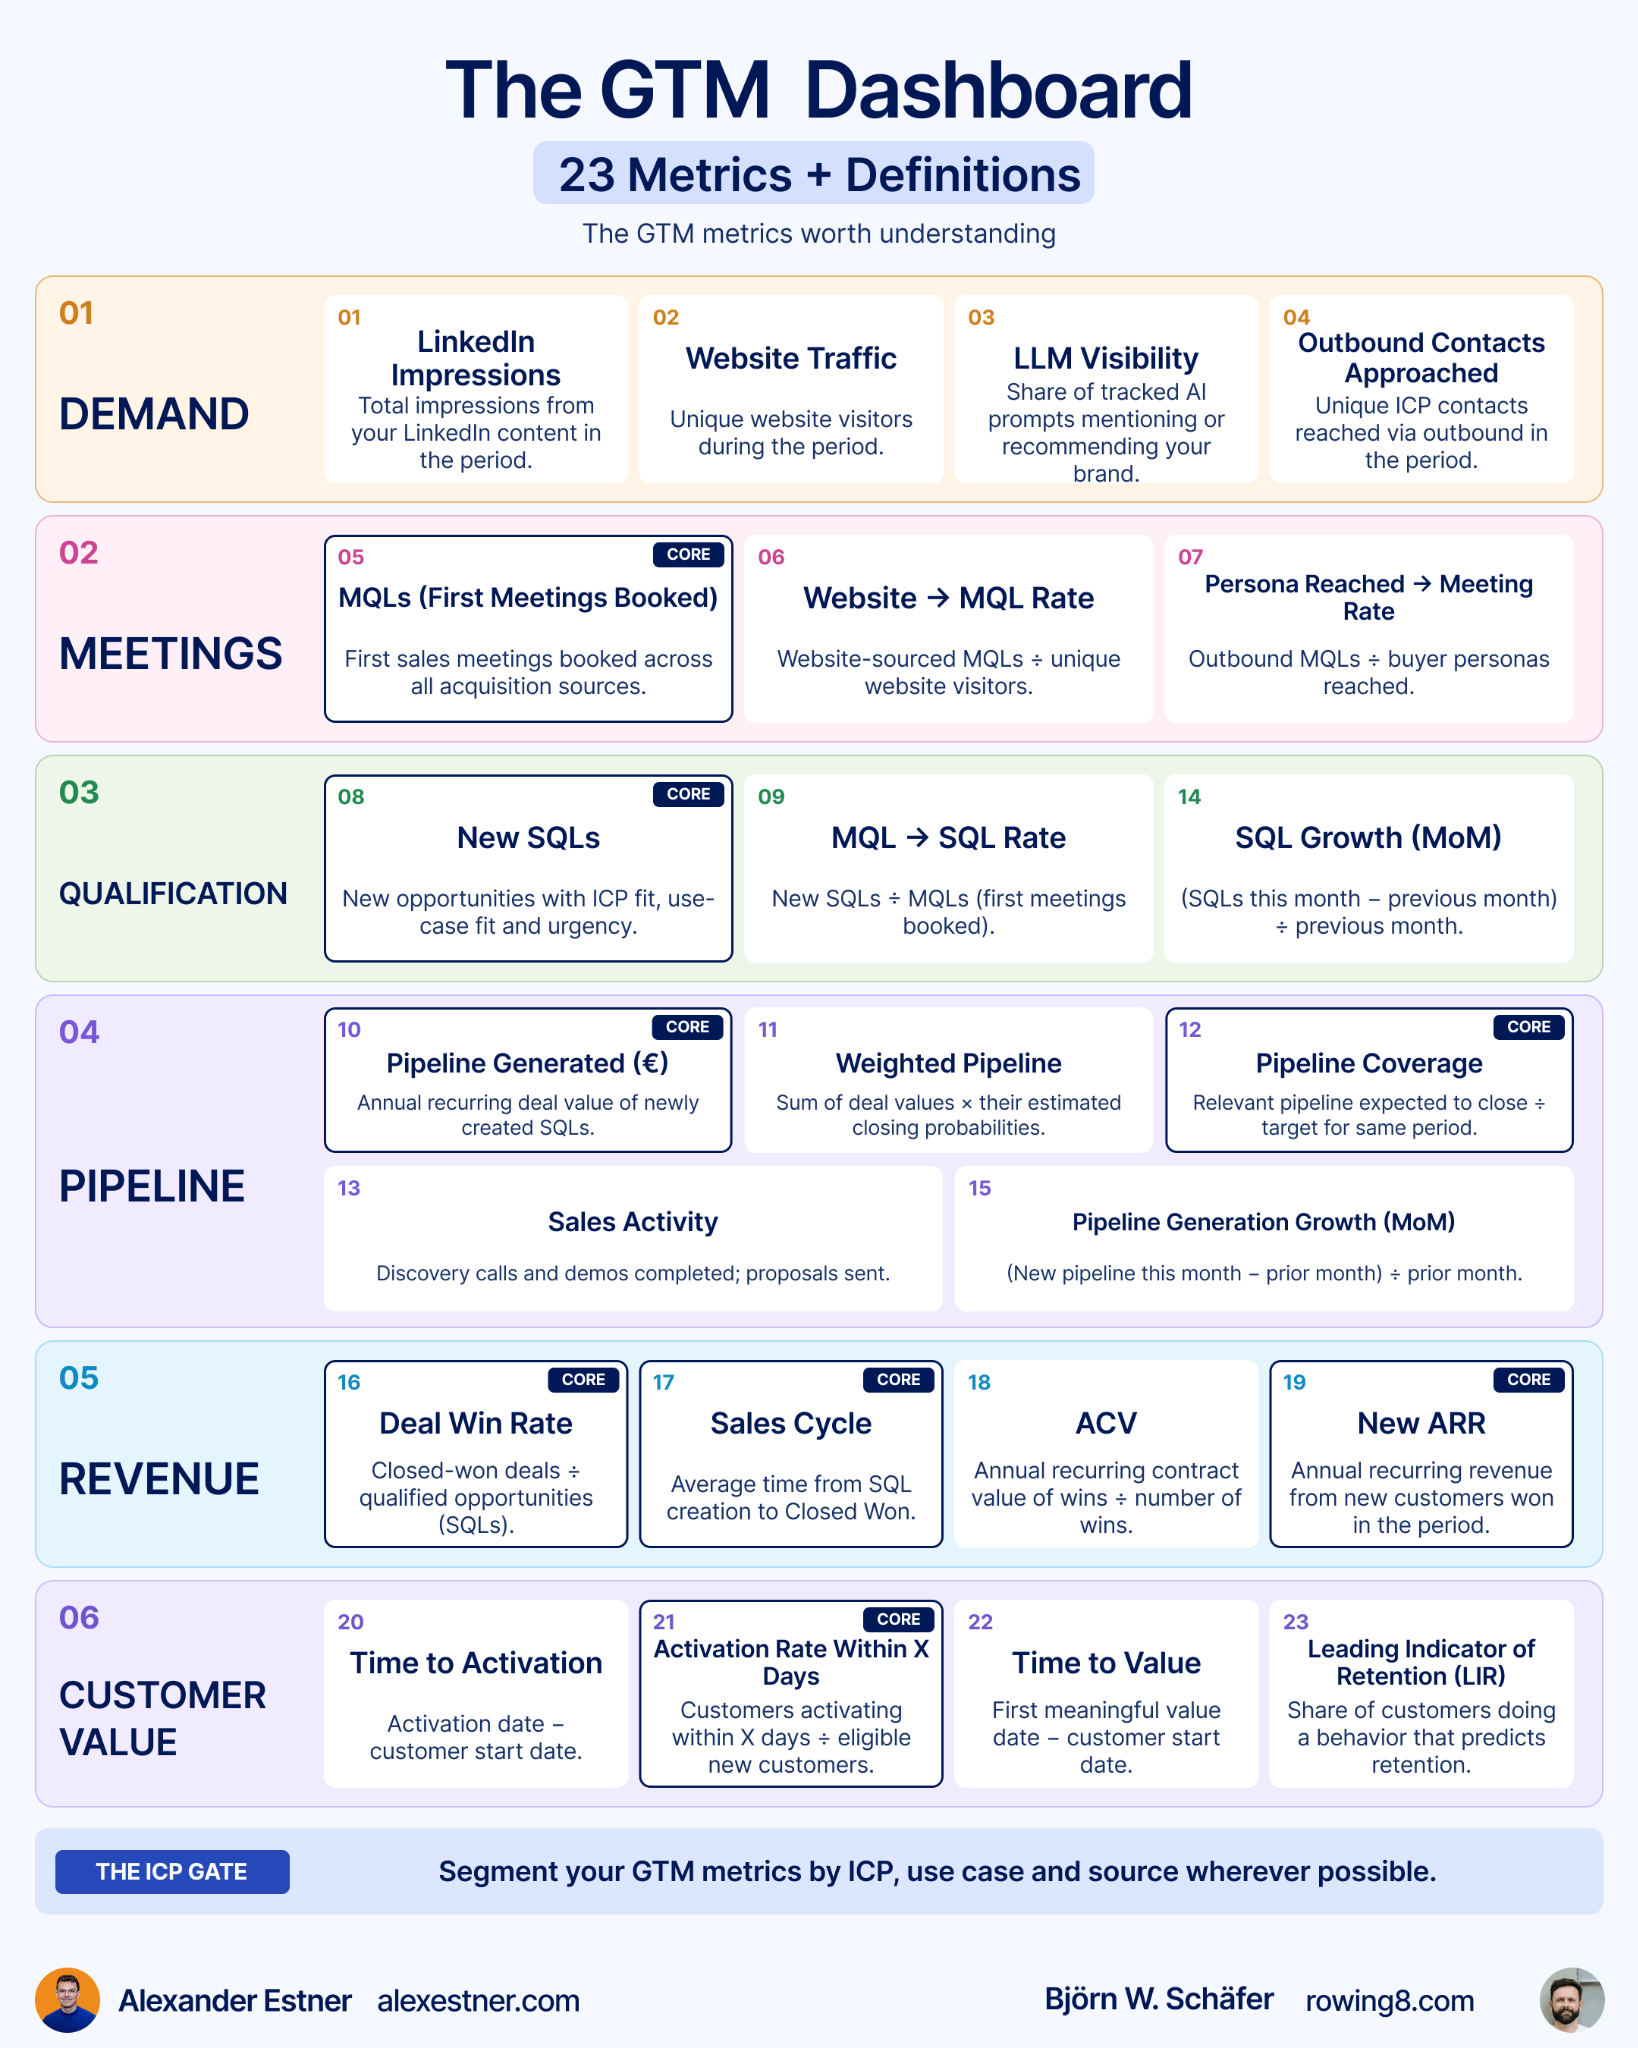
Get the full 23-metric GTM Dashboard Guide
In the full guide, Björn and I break down all 23 metrics across demand generation, outbound, qualification, pipeline, revenue, and customer value.
For each, you’ll find the formula, why it matters, how to improve it, and what to watch out for.
Bonus: GTM Cockpit

Your dashboard isn’t there to make reporting look nice. It’s there to help you make better GTM decisions.
That’s it for today.
Alex & Björn
P.S. Which GTM metric are you currently struggling with most? Reply to this email. We’d love to hear what’s working (or not working) in your GTM.
3 ways I help founders build a strong GTM foundation 👇
If you’re somewhere between €0 → €1M ARR, I can help you with your GTM.
1️⃣ Free GTM Foundation Library
→ 50+ resources (guides, templates, frameworks)
2️⃣ GTM Audit
→ 360° assessment + 6-month action plan: Your GTM blind spots revealed
3️⃣ 1:1 GTM Advisory
→ Work directly with me to build your GTM